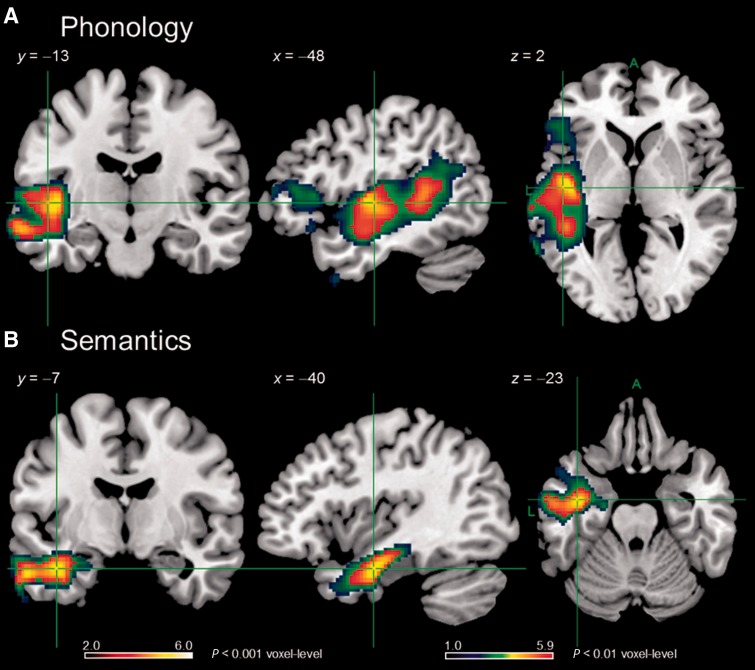
Figure 5.
Regions found to relate significantly and uniquely to phonological (A) and semantic (B) performance in VBCM analyses. Hot overlays are clusters significant at P < 0.001 voxel-level, P ≤ 0.001 FWE-corrected cluster-level and which were interpreted in the text. Cluster sizes 2622 (A) and 856 (B) voxels. Image threshold (t) 2.0–6.0. ACTC (blue/green) overlays are clusters significant at P < 0.01 voxel-level, P ≤ 0.001 FWE-corrected. Image threshold (t) 1.0–5.9.

