
Figure 6.
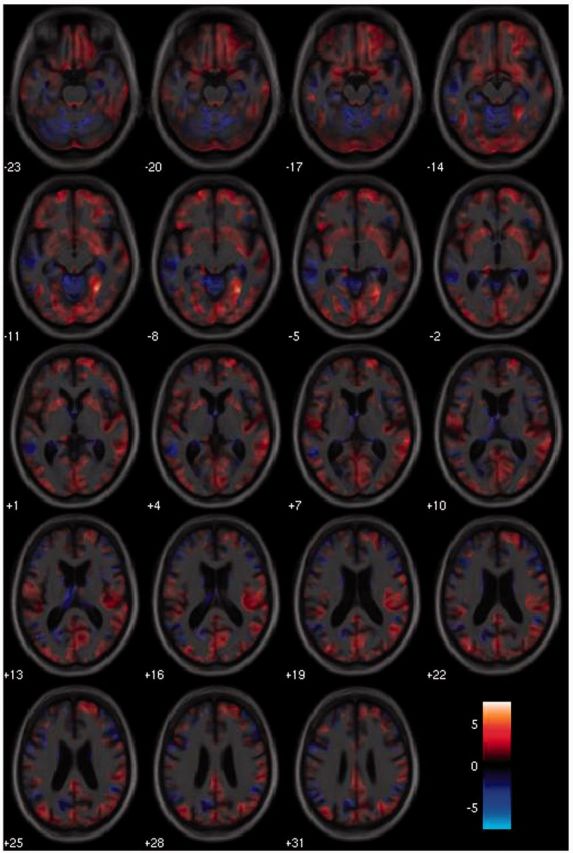
T-contrast effect maps showing associations between a measure of crowding [spacing (shapes/numbers)] and grey matter volume displayed on axial sections. Warmer colours indicate stronger positive associations between a greater degree of crowding and lower grey matter volume, with cooler colours representing the reverse contrast. The colour-map indicates t-values for this association.