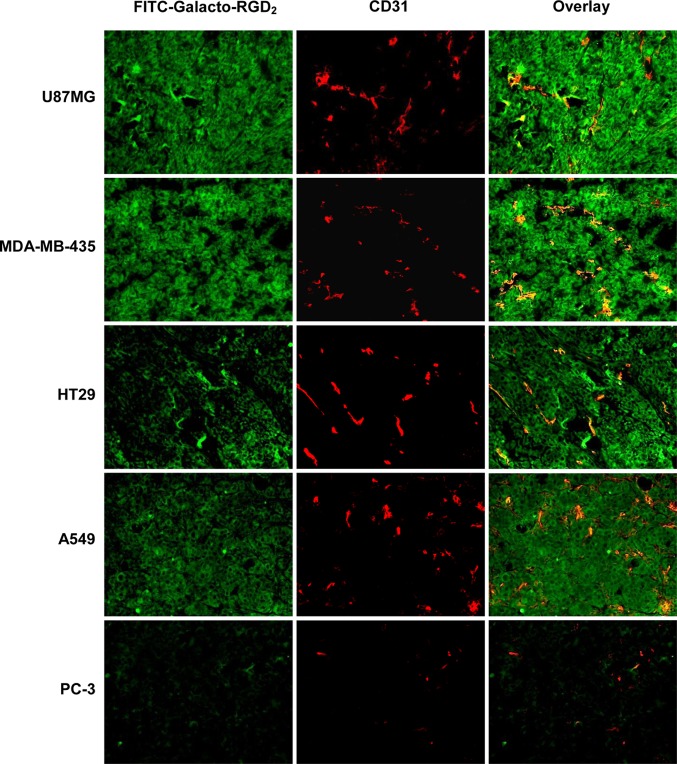
Figure 11.
Representative fluorescence microscopic images (Magnification: 200×) of selected tumor slices stained with FITC-Galacto-RGD2 (green) and rat anti-mouse CD31 antibody detected with Cy3 conjugated goat anti-rat antibody (red). Orange or yellow color in overlay images indicates co-localization of FITC-Galacto-RGD2 (green) and CD31 antibody in tumor tissues.

