Figure 13.
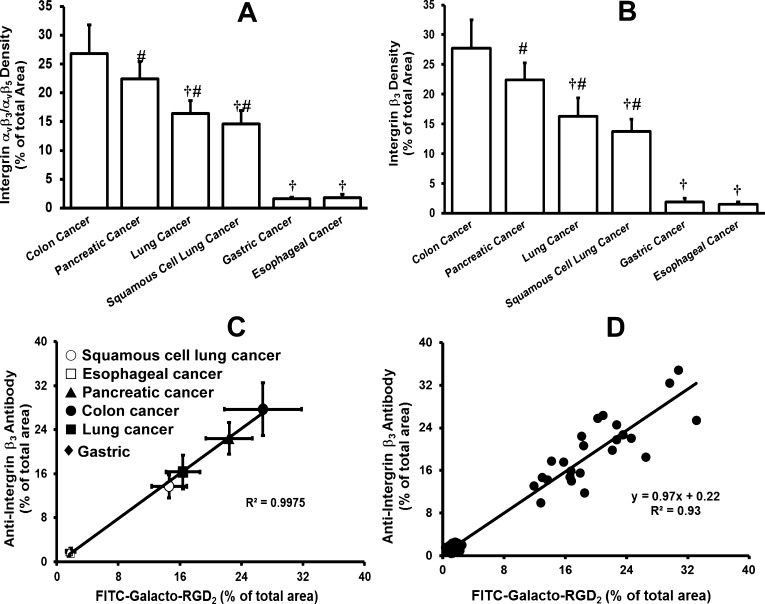
(A) Quantitative analysis of integrin αvβ3 density for six different human cancer tissues (colon cancer, pancreatic cancer, lung adenocarcinoma, squamous cell lung cancer, gastric cancer, and esophageal cancer) stained with FITC-Galacto-RGD2 (green). Integrin αvβ3 density on tumor cells and neovasculature is represented by the percentage of green area over the total area in each tumor slice. (B) Quantitative analysis of integrin β3 density for six human cancer tissues (colon cancer, pancreatic cancer, lung adenocarcinoma, squamous cell lung cancer, gastric cancer, and esophageal cancer) stained with rabbit anti-human integrin β3 antibody detected with the TR-conjugated goat anti-rat antibody (red). Integrin αvβ3 density on tumor cells and neovasculature is represented by the percentage of red area over the total area in each slice of tumor tissue. (C) (average data) and (D) (single data): Linear relationship between the relative integrin αvβ3 expression levels (fluorescence density) determined with FITC-Galacto-RGD2 and those obtained with rabbit anti-human integrin β3 antibody in six human tumors (colon cancer, pancreatic cancer, lung adenocarcinoma, squamous cell lung cancer, gastric cancer, and esophageal cancer). Each data point was derived from 15 different areas of the same tumor slice. Experiments were repeated three times independently with very similar results. All values were reported as the average plus/minus standard deviation. †: p < 0.01, significantly different from the colon cancer group; #: p < 0.01, significantly different from the gastric cancer group.

