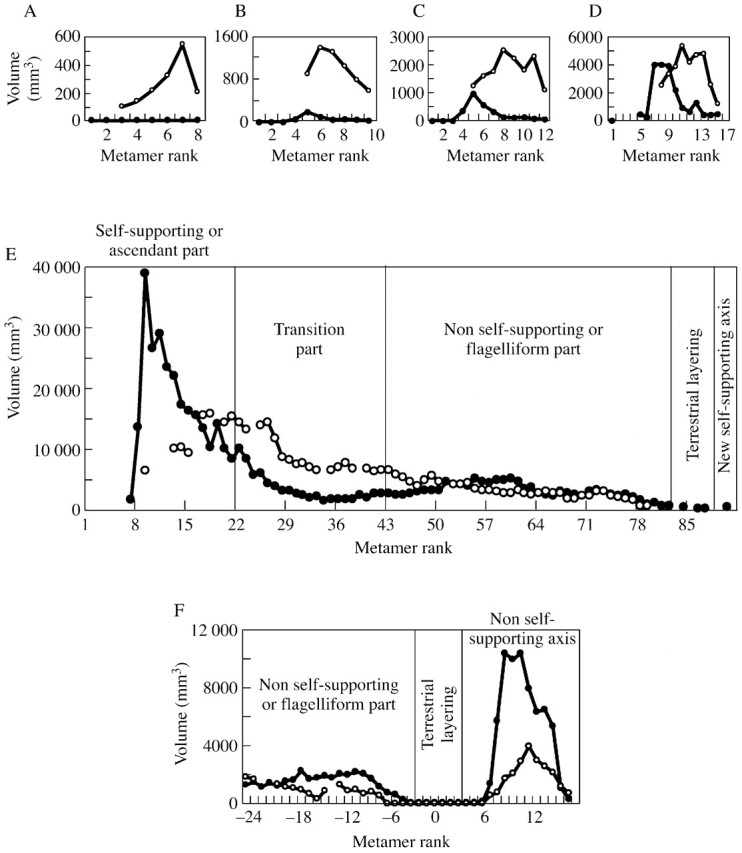
Fig. 3. Patterns of variation in pith volume and leaf volume for successive metamer‐forming axes of individuals at different developmental stages. Variations occurred from the base towards the axis tip. Each graph represents a developmental stage: stage a (A), stage b (B), stage c (C), stage d (D) and stage e (E). F, Variations at the end of part 3 (flagelliform part) for an individual at stage e. Closed circles, pith volume variations; open circles, variations in leaf volume.
