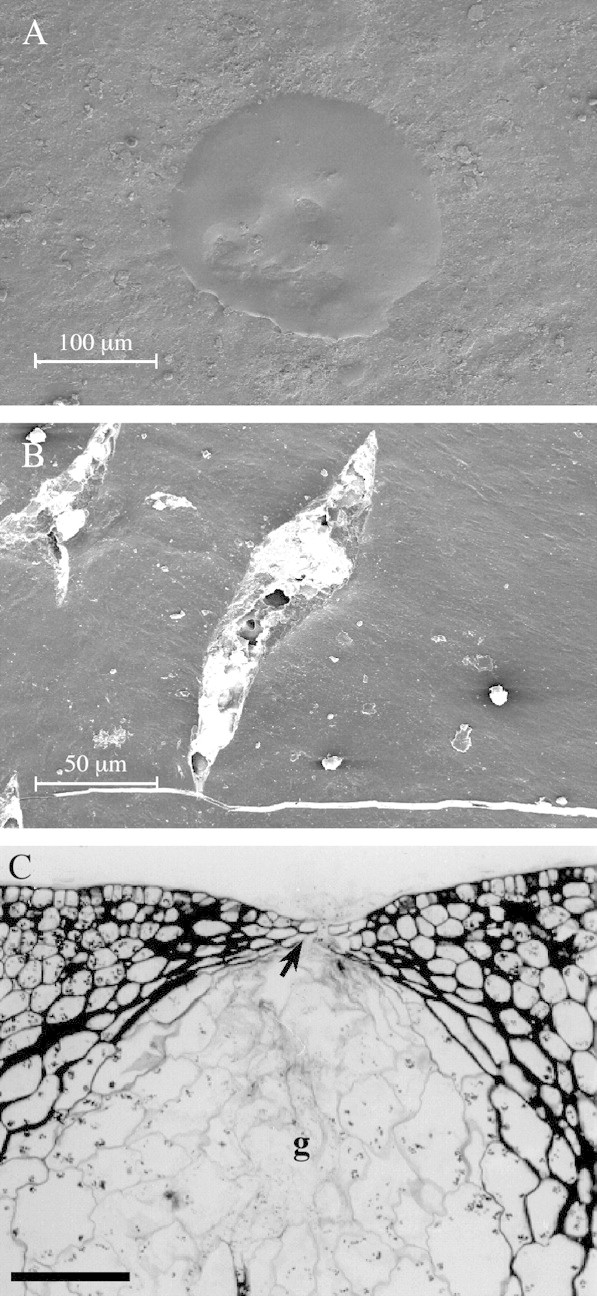
Fig. 3. Rind surface damage due to penetrometer action. A, SEM image of oil pool on the rind surface above a ruptured gland, immediately after damage. Bar = 100 µm. B, SEM image of tears and cracks in the rind surface, immediately after damage. Bar = 50 µm. C, Longitudinal, aldehyde‐fixed, PAS/TBO stained section of the ruptured epidermis (arrow) above a gland (g), immediately after damage. Bar = 100 µm.
