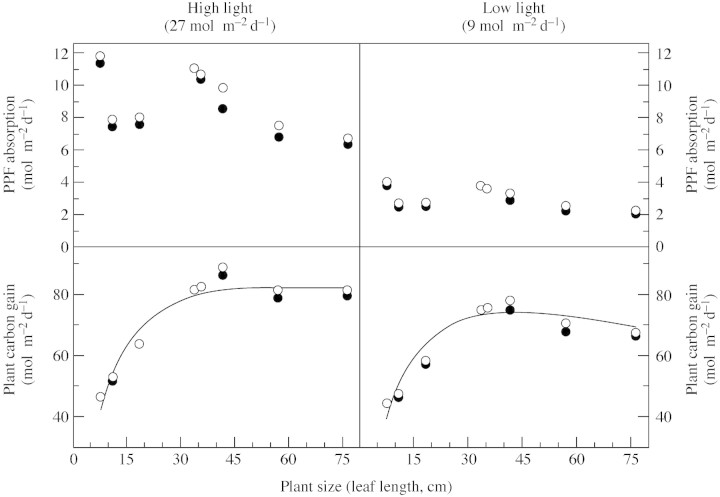
Fig. 4. PPF absorption and corresponding carbon gain by V. sanguinolenta plants of different sizes in two light environments as calculated by Y‐plant. Closed symbols indicate simulated, normal plants; open symbols indicate plants modified to exhibit a divergence angle of 137·5° between successive leaves. Regression lines are y = 82 (1–e–0·009x) (r2 = 0·94) and y = 73·9 e(–0·5 (ln (x/428)/1·552) (r2 = 0·92).

An official website of the United States government
Here's how you know
Official websites use .gov
A
.gov website belongs to an official
government organization in the United States.
Secure .gov websites use HTTPS
A lock (
) or https:// means you've safely
connected to the .gov website. Share sensitive
information only on official, secure websites.
