
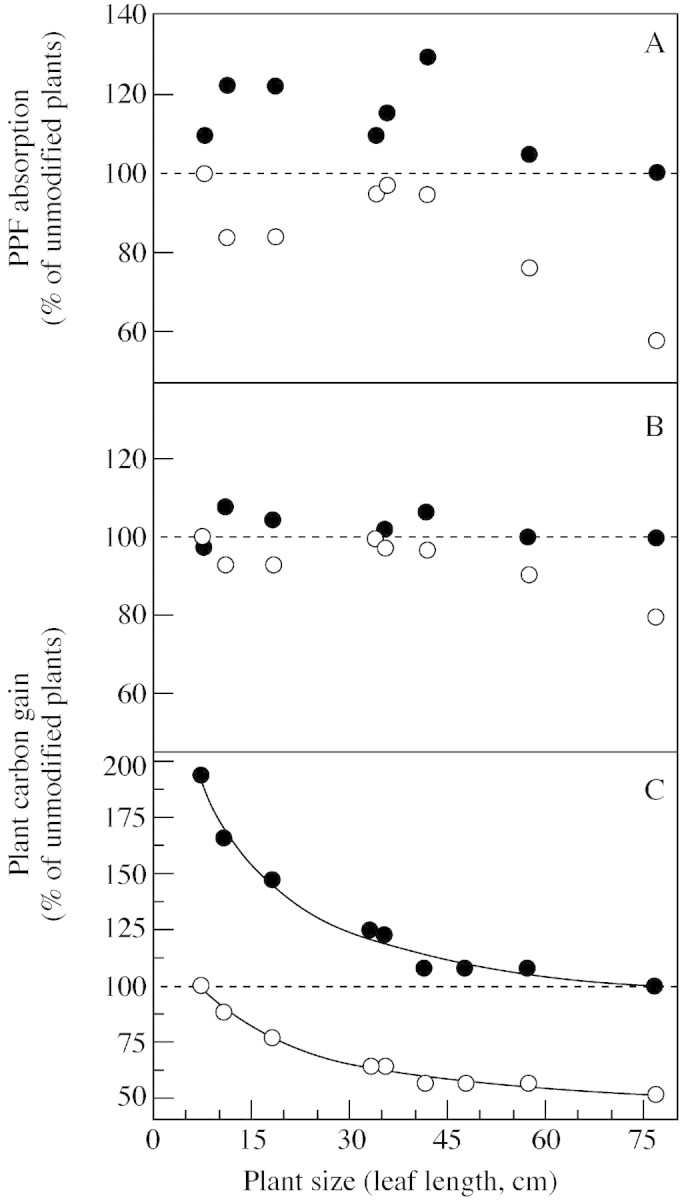
Fig. 5. PPF absorption (A) and carbon gain (B and C) by V. sanguinolenta plants of different sizes. Plants were simulated with Y‐plant using the morphology of the largest (closed symbols) or smallest plants (open symbols) (A and B), or using the physiology of the largest (closed symbols) or smallest plants (open symbols) (C). Dotted lines indicate values for plants simulated without such modifications in morphology or physiology. Regression lines in C are hyperbolic decay functions: PCG = 80 + (17220/(82·1 + LLmax)) for upper line, PCG = 40 + (9720/(90+ LLmax)) for lower line; r2 > 0·98. Calculations were carried out using the smallest daily photon flux that plants experience in nature (9 mol m–2 d–1; Schmidt and Zotz, 2001).