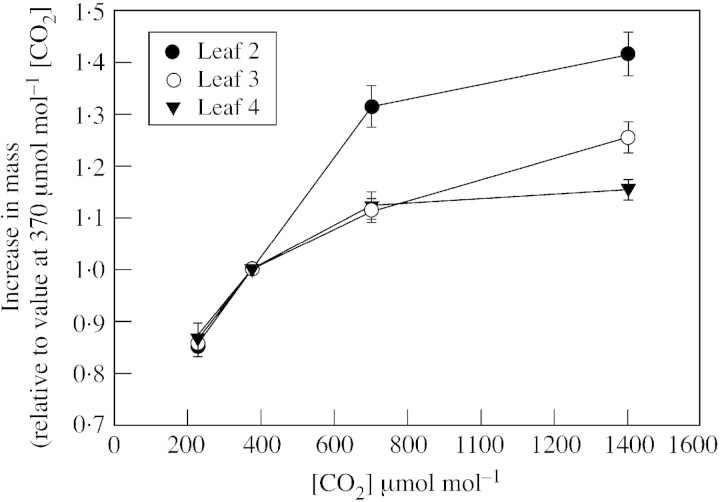
Fig. 1. The increase in dry mass over three 24‐h periods for soybean leaves exposed to various [CO2] during the dark periods, but 350 µmol mol–1 [CO2] during the light periods. Values for second, third and fourth trifoliolate leaves are expressed relative to values of the same leaves exposed to 370 µmol mol–1 [CO2] during the dark. Vertical bars indicate s.e.

An official website of the United States government
Here's how you know
Official websites use .gov
A
.gov website belongs to an official
government organization in the United States.
Secure .gov websites use HTTPS
A lock (
) or https:// means you've safely
connected to the .gov website. Share sensitive
information only on official, secure websites.
