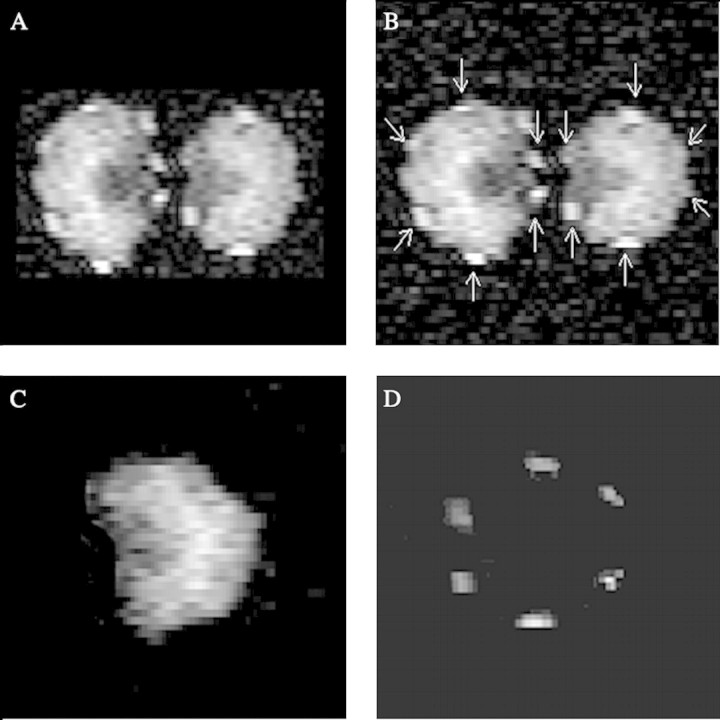
Fig. 3. NMR images of transverse slice across ajowan schizocarp (A and B) and mericarp (C and D). Spatial resolution is 25 µm × 25 µm and slice thickness is 300 µm. A, Non‐selective image of overall lipid distribution, comprising reserve oil and thymol; B, same image as in A showing location of oil canals; C, chemical shift selective image (δ = 5·2 ppm) of reserve oil (triglyceride) distribution; D, chemical shift selective image (δ = 6·2 ppm) of thymol distribution. The image corresponds with the location of the canals as shown in Fig. 1B, and confirms that thymol is localized in the canals.

An official website of the United States government
Here's how you know
Official websites use .gov
A
.gov website belongs to an official
government organization in the United States.
Secure .gov websites use HTTPS
A lock (
) or https:// means you've safely
connected to the .gov website. Share sensitive
information only on official, secure websites.
