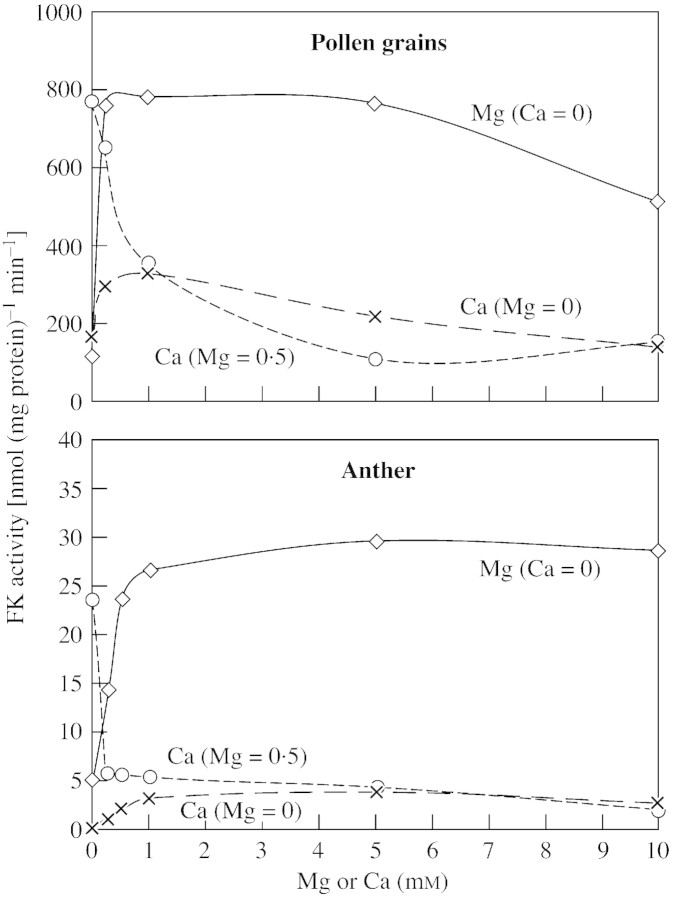
Fig. 3. Effects of CaCl2 and MgCl2 concentrations in the reaction mixture on the activity of fructokinase extracted from pollen grains (A) and anther tissue (B). The dashed line with open circles represents the effect of CaCl2 in the presence of 0·5 mm MgCl2. Data are means (n = 5) ± s.e. Each assay mixture contained 20 µg protein.

An official website of the United States government
Here's how you know
Official websites use .gov
A
.gov website belongs to an official
government organization in the United States.
Secure .gov websites use HTTPS
A lock (
) or https:// means you've safely
connected to the .gov website. Share sensitive
information only on official, secure websites.
