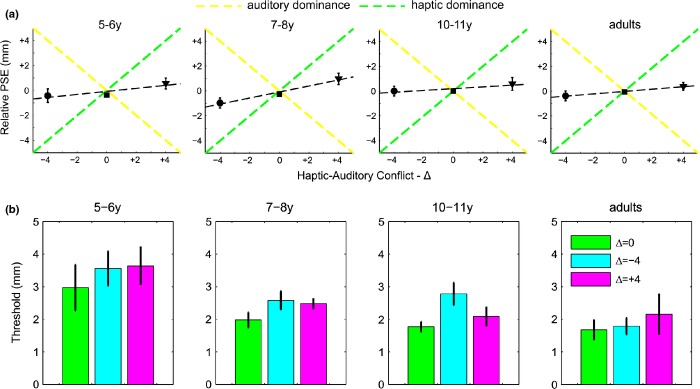
Figure 5.

Predictions and behavior in the conflict condition. (a) The black symbols and dashed line represent the measured PSEs in the conflict condition (on the ordinate) plotted against the three level of haptic-auditory conflict (−4, 0, +4 mm). The yellow dashed line represents the prediction for the auditory dominant model, the green dashed line for the haptic dominant model. Error bars represent standard error of the mean. (b) Mean discrimination thresholds for bimodal congruent (green bar), −4Δ (cyan bar), and +4Δ (magenta bar) conditions as a function of age (different panels). Error bars represent standard error of the mean.
