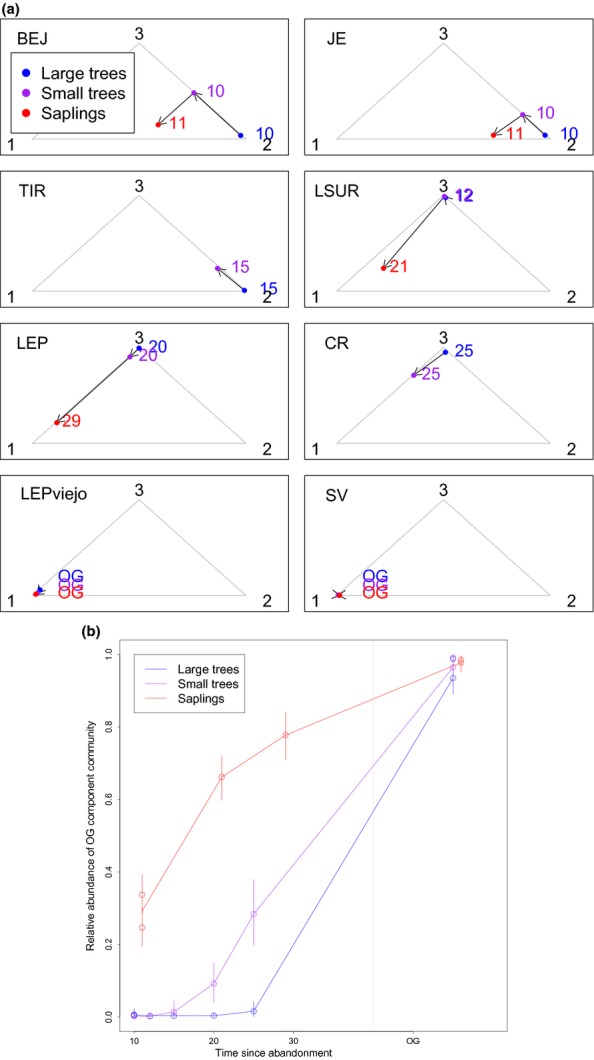
Figure 5.

Temporal patterns inferred from the Costa Rican chronosequence based on LDA output. Panel (a) shows modelling results for each site (name of site is given on the upper left corner of each subpanel), where the relative abundance of communities was converted to barycentric coordinates to allow their display within the simplex (grey triangle). In these coordinates, observations close to triangle vertices indicate plots dominated by the respective community (black numbers). Red, purple and blue circles refer to results from sapling, small tree and large tree data respectively. Corresponding colour-coded numbers refer to time since abandonment (OG stands for old growth). Arrows indicate inferred progression in species composition. Panel (b) shows a summary of the old-growth component community patterns. Vertical bars correspond to 95% credible intervals and results are displayed separately for large trees (blue), small trees (purple) and saplings (red).
