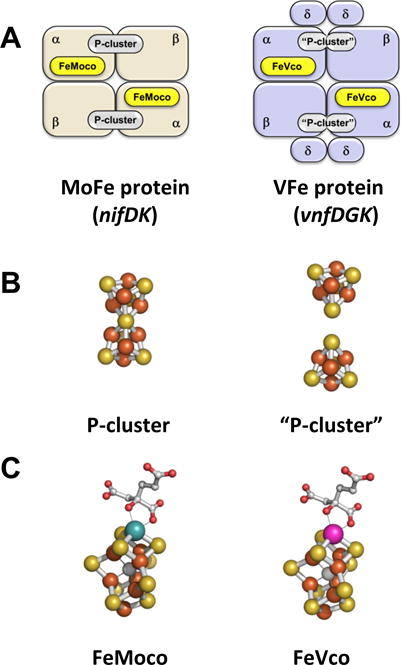
Figure 1.

Comparison between the Mo- and V-nitrogenases. Schematic presentations of the catalytic components (A) and structural models of the P-clusters (B) and cofactors (C) in Mo- (left) and V- (right) nitrogenases. Atoms are colored as follows: Fe, orange; S, yellow; Mo, cyan; V, magenta; O, red; C, gray.
