
Figure 2.
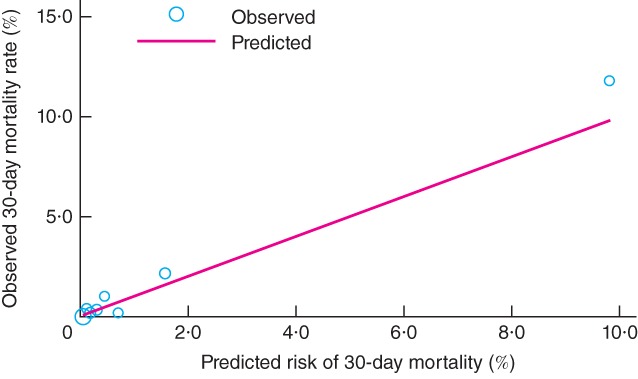
Observed versus predicted 30-day mortality at varying levels of risk in the validation cohort of 5569 patients undergoing non-cardiac surgery. Circle size corresponds to the proportion of patients at each level of risk
Official websites use .gov
A
.gov website belongs to an official
government organization in the United States.
Secure .gov websites use HTTPS
A lock (
) or https:// means you've safely
connected to the .gov website. Share sensitive
information only on official, secure websites.
Observed versus predicted 30-day mortality at varying levels of risk in the validation cohort of 5569 patients undergoing non-cardiac surgery. Circle size corresponds to the proportion of patients at each level of risk