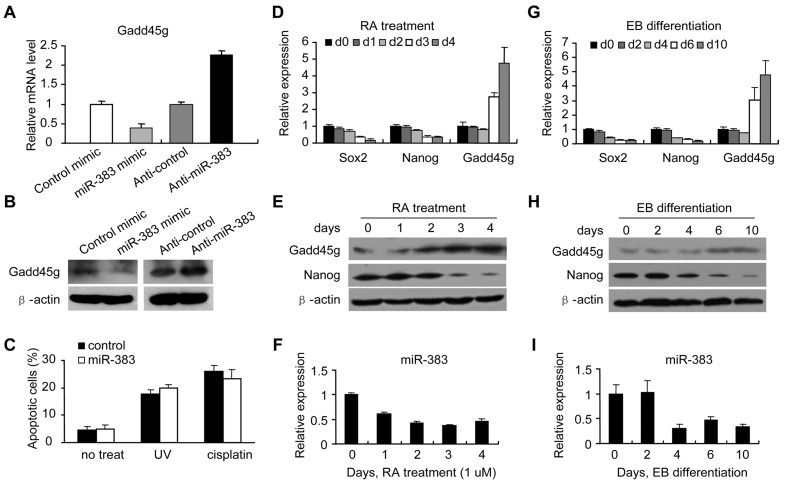
Figure 4. miR-383 regulates Gadd45g in mouse ES cells.
(A) Relative mRNA expression of Gadd45g was measured by qRT-PCR in mouse ES cells (R1) transfected with miR-383 mimic or anti-miR-383. (B) Gadd45g protein levels were determined by western blotting in R1 cells. β-actin was used as a loading control. (C) R1 cells were transfected with miR-383 or control, followed by treatment with UV irradiation (50 J/m2, 12 h) or cisplatin treatment (10 µM, 24 h). The apoptosis was measured by Annexin V/PI staining. (D) Quantitative RT-PCR and (E) western blotting analysis were performed in ES cells and differentiated ES cells treated with RA (1 µM) for indicated days. (F) Quantitative RT-PCR data for miR-383 were performed in cells mentioned in (D), and normalized to the level of U6. (G) Quantitative RT-PCR and (H) western blotting analysis were performed in ES cells and cultured EB. (I) Quantitative RT-PCR data for miR-383 were performed in ES cells and cultured EB. In (D) and (G), data are expressed as relative expression compared with ES cells (set as 1.0). Values are means ± SD. In (E) and (H), β-actin was used as a loading control.

