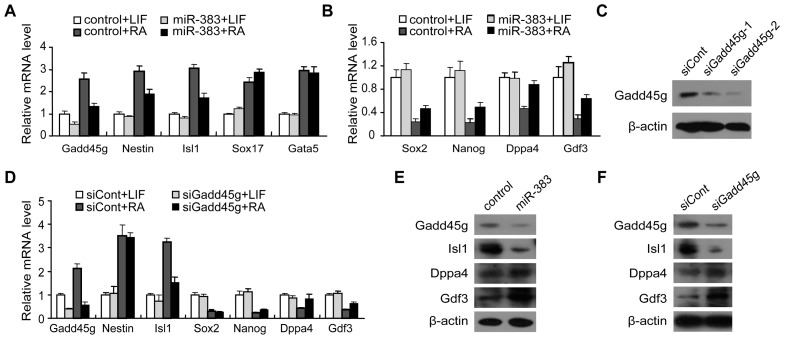
Figure 5. miR-383 modulates ES cell differentiation through Gadd45g.
(A and B) Quantitative RT-PCR analysis for differentiation (A) and pluripotency (B) marker genes in miR-383 mimic or control transfected ES cells cultured with LIF or with RA for 3 days. The data are shown as relative expression compared with the control cells cultured in the presence of LIF (set as 1.0). Values are means ± SD. (C) Protein levels of Gadd45g were detected in R1 cells transfected with Gadd45g siRNAs. (D) Quantitative RT-PCR was performed to analyze the expression of Nestin, Nanog, Sox2, Dppa4, Gdf3, and Isl1 between control and Gadd45g siRNA transfected ES cells cultured with LIF or RA. The mRNA levels at control siRNA transfected cells were set at 1.0. Values are means ± SD. (E and F) The protein levels of Isl1, Dppa4 and Gdf3 were examined by western blotting after miR-383 overexpression (E)or Gadd45g siRNA (F) in the conditions of RA treatment.

