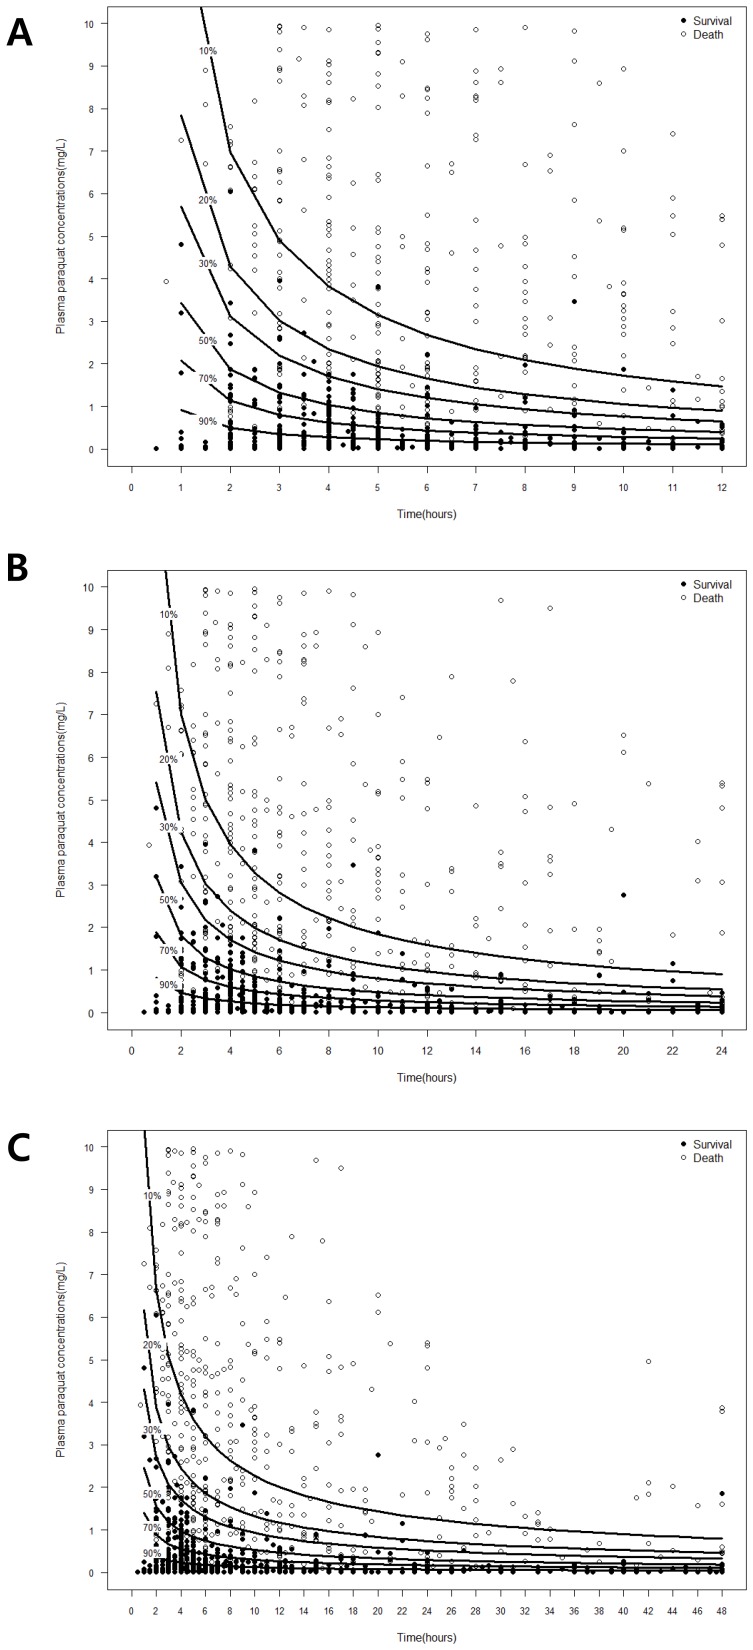
Figure 1. Contour graph showing relation between plasma paraquat concentration (µg/ml), time after ingestion, and probability of survival.
A. Probability curve of patients who were admitted to our hospital within 12 h after ingestion of paraquat. B. Probability curve of patients who were admitted to our hospital within 24 h after ingestion of paraquat. C. Probability curve of all patients who were admitted to our hospital at any time after ingestion of paraquat.

