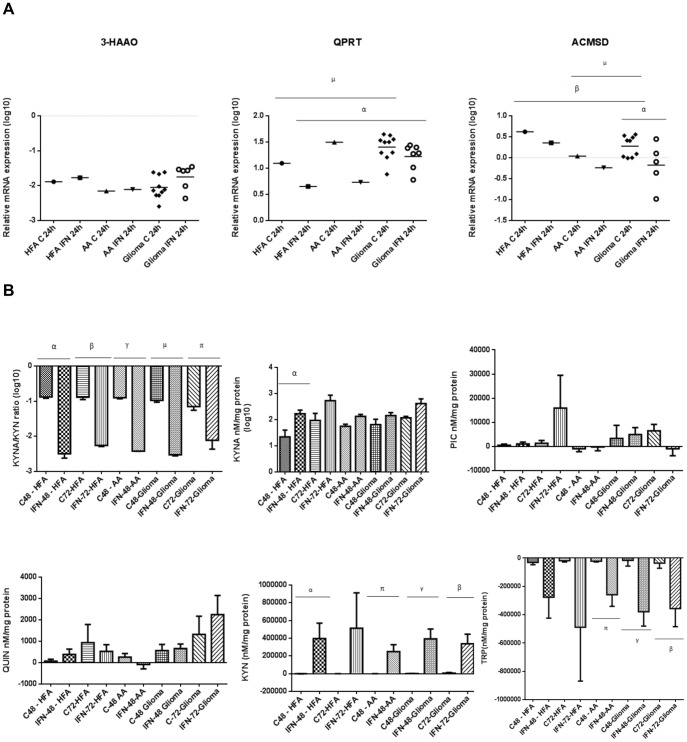
Figure 4. Relative mRNA expression of KP enzymes in HFA and AA versus glioma using qRT-PCR and analysis of the KYNA/KYN ratio and KYNA, PIC, QUIN, KYN and TRP concentrations in the cell culture supernatants of glioma, HFA and AA cells.
(A) The dot plots indicate the relative mRNA expression normalised to HPRT mRNA expression; All cell cultures were untreated (C) and treated with IFN-γ (IFN) for 24 hours; Graphs indicate Log10 of the quantified values. No statistical significance was observed for 3-HAAO expression; QPRT expression in unstimulated glioma (n = 10) compared to unstimulated HFA cells (µp = 0.0024); QPRT expression in stimulated glioma cells (n = 7) compared to stimulated HFA cells (αp = 0.0015). ACMSD expression in stimulated glioma cells (n = 5) compared to unstimulated (αp<0.05); ACMSD expression in unstimulated glioma cells (n = 9) compared to unstimulated HFA cells (βp = 0.0029); ACMSD expression in unstimulated glioma cells compared to unstimulated AA (µp<0.05). (B) Glioma cell cultures for the KYNA/KYN ratio and KYNA concentrations were untreated (n = 7) and treated with IFN-γ (n = 6) for 48 hours and untreated (n = 6) and treated with IFN-γ for 72 hours (n = 6); HFA cell cultures for the analysis of the KYNA/KYN ratio and KYNA concentrations were untreated (n = 8) and treated with IFN-γ (n = 8) for 48 hours and untreated (n = 5) and treated with IFN-γ for 72 hours (n = 5); All AA cell cultures were untreated (n = 3) and treated with IFN-γ (n = 3) for 48 hours; Bar graphs for the KYNA/KYN ratio and KYNA concentrations indicate Log10 of the quantified values; The KYNA/KYN ratio in glioma, HFA and AA cell cultures after 48 and 72 hours of IFN-γ stimulation compared to untreated cultures (αβγµπp<0.001); KYNA concentrations in HFA cell cultures when treated with IFN-γ for 48 hours compared to when untreated after 48 hours (αp<0.05); Glioma cell cultures for the analysis of QUIN and PIC concentrations were untreated (n = 7) and treated with IFN-γ (n = 6) for 48 hours and untreated (n = 5) and treated with IFN-γ for 72 hours (n = 5); HFA cell cultures for the analysis of QUIN and PIC concentrations were untreated (n = 10) and treated with IFN-γ (n = 9) for 48 hours and untreated (n = 5) and treated with IFN-γ for 72 hours (n = 5); No statistical significance was observed for QUIN and PIC; Glioma cell cultures for the analysis of KYN and TRP concentrations were untreated (n = 7) and treated with IFN-γ (n = 6) for 48 hours and untreated (n = 6) and treated with IFN-γ for 72 hours (n = 5); HFA cell cultures for the analysis of KYN and TRP concentrations were untreated (n = 9) and treated with IFN-γ (n = 9) for 48 hours and untreated (n = 5) and treated with IFN-γ for 72 hours (n = 5); KYN production in glioma cell cultures after 48 and 72 hours of IFN-γ stimulation compared to untreated cultures after 48 and 72 hours (γβp<0.01); KYN production in HFA cell cultures after 48 hours of IFN-γ stimulation compared to untreated cultures after 48 hours (αp<0.05); KYN production in AA after 48 hours of IFN-γ stimulation compared to the untreated cultures (πp<0.05); TRP catabolism in AA cell culture supernatant after 48 hours of IFN-γ stimulation compared to untreated cultures after 48 hours (πp<0.05); TRP catabolism in glioma cell culture supernatant after 48 and 72 hours of IFN-γ stimulation compared to untreated cultures after 48 hours (γβp<0.05). No other statistical significance was observed.

