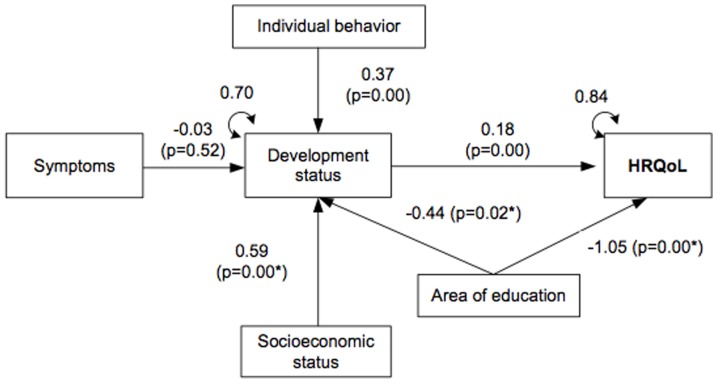
Figure 3. Measurement of variables and standardized estimates (β, ρ values and residual variances) of the test of the Wilson and Cleary theoretical framework using pediatric data.
(Note: χ2 = 5.5; df = 6; p = 0.48; SRMR = 0.01. Standardized coefficients are given. *P value and coefficients with the highest effect in categories of the dummy variables socioeconomic status and area of education.

