
Figure 1.
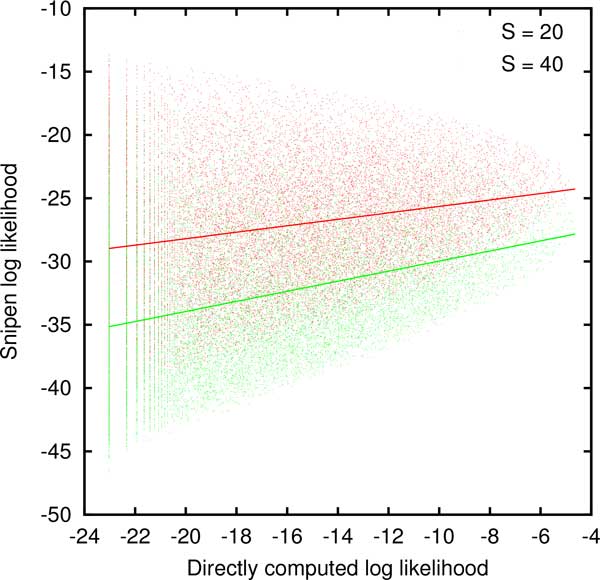
The approximate log likelihood introduced by Snipen et al for every possible set of gene counts γgvs. the directly computed log likelihood for G = 5 and M = 10. The solid lines are linear fits to the S = 20 (red) and S = 40 (green) clouds.
Official websites use .gov
A
.gov website belongs to an official
government organization in the United States.
Secure .gov websites use HTTPS
A lock (
) or https:// means you've safely
connected to the .gov website. Share sensitive
information only on official, secure websites.
The approximate log likelihood introduced by Snipen et al for every possible set of gene counts γgvs. the directly computed log likelihood for G = 5 and M = 10. The solid lines are linear fits to the S = 20 (red) and S = 40 (green) clouds.