
Figure 5.
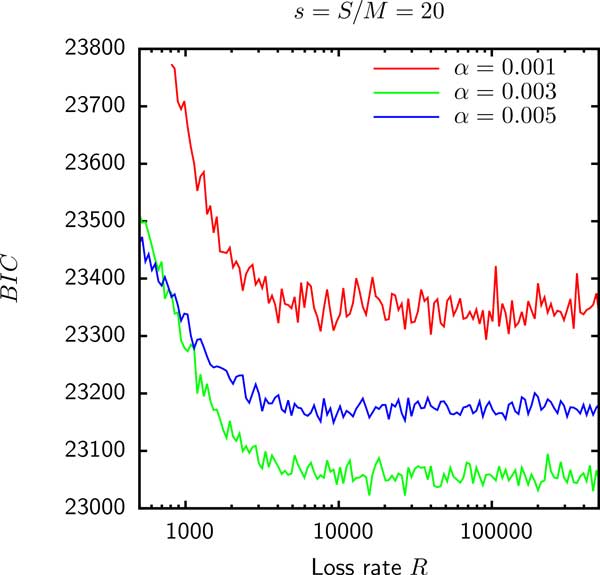
The BIC for the model E fit to the gene frequencies in group 6 is minimized in the R → ∞. The same situation is observed in groups 1, 4, 5, and 8.
Official websites use .gov
A
.gov website belongs to an official
government organization in the United States.
Secure .gov websites use HTTPS
A lock (
) or https:// means you've safely
connected to the .gov website. Share sensitive
information only on official, secure websites.
The BIC for the model E fit to the gene frequencies in group 6 is minimized in the R → ∞. The same situation is observed in groups 1, 4, 5, and 8.