
Figure 7.
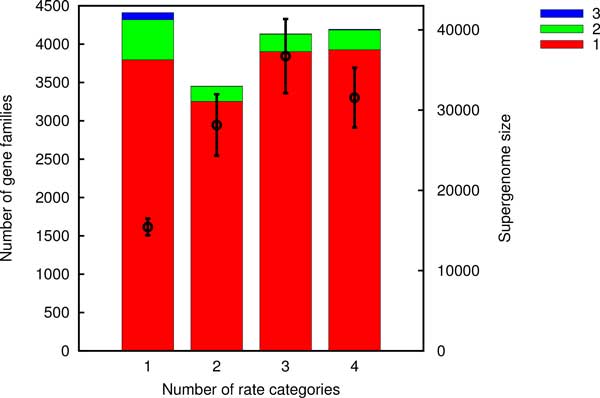
Estimated number of gene families gained once, twice and thrice as a function of the Count model complexity for group 2. The symbols with error bars (right y-axis) are the corresponding supergenome size estimates using the uniform gain probability Model F1.