
Fig 2.
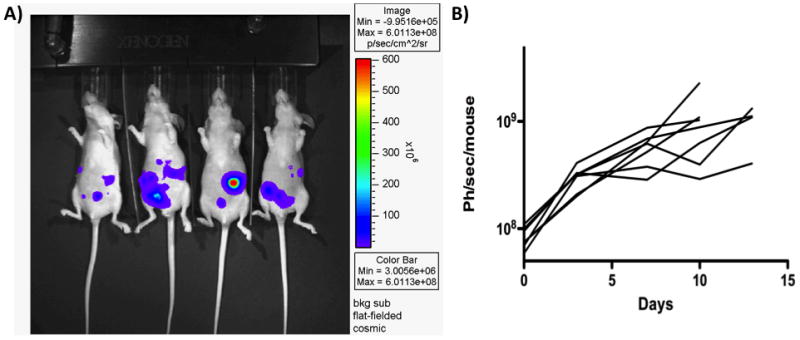
(A) Representative image produced for mice with luciferase labeled ovarian cancer cell line implanted into the peritoneal cavity. Individual tumor nodules can be visualized. (B) The tumor burden from these mice was quantified as a measure of light output and plotted over time (with each graph representing an individual mouse implanted with the same tumor cell line).