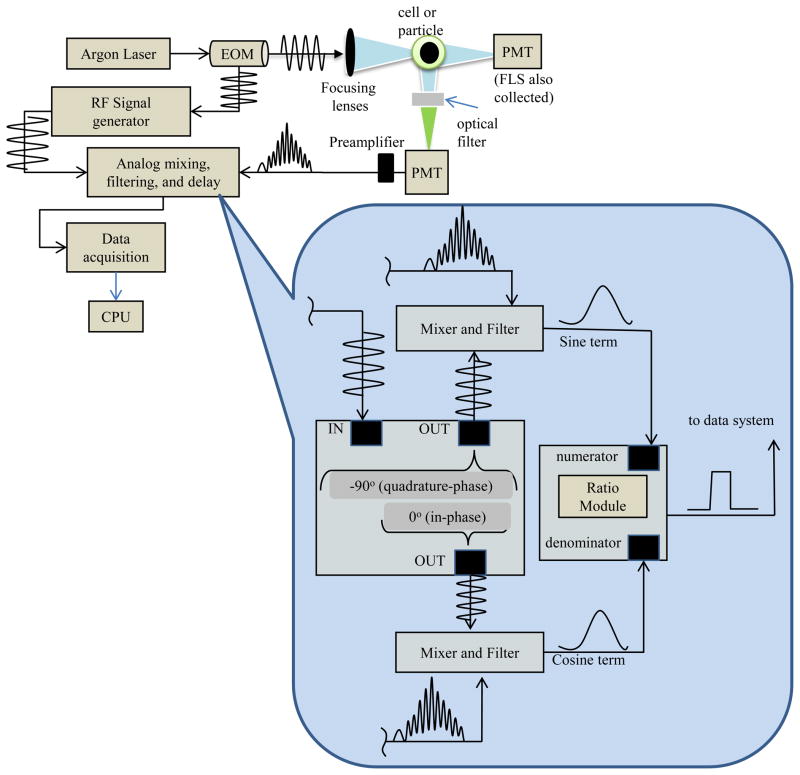
Figure 2.
Illustration of frequency-domain flow cytometry hardware modification. This depiction assumes the particles are flowing into the page. Modulated fluorescence emission signals resulting from a modulated laser source during frequency-domain data acquisition are captured by photomultiplier tubes (PMTs). The diagram represents a waveform from a post-amplified signal that is directed to mixing and filtering steps. The bottom callout illustration exemplifies the analog homodyning hardware necessary for only one detector. The fluorescence signal is split, mixed with a reference sine waves that have been phase shifted in time. After mixing, the signals are filtered down and then divided by an analog ratio module. Ultimately, the ratioed signal is digitized into list mode cytometric data.

