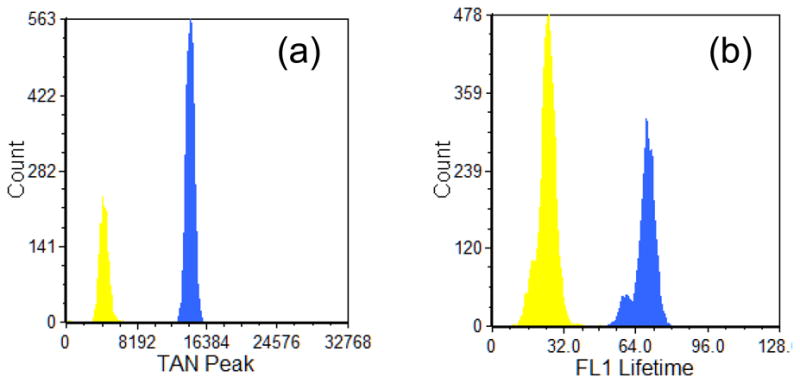
Figure 5.

Examples of fluorescence lifetime histograms acquired with the analog phase sensitive flow cytometry approach and the digital fluorescence lifetime method. (a) Histogram results with the analog system where the parameter plotted is the peak of the tangent of the phase shift measurement in arbitrary units labeled as ‘TAN peak’. The tangent value presents a proportionality to the fluorescence lifetime of the sample. Flow-Check™ (Beckman Coulter, blue histogram) and Yellow-Green (Spherotech, yellow histogram) microspheres resulted in fluorescence lifetime values of 7.0 ns (+/−0.22ns) and 2.1 ns (+/−0.24ns), respectively. (b) The fluorescence lifetime of the Flow-Check™ (Beckman Coulter, blue histogram) and Yellow-Green (Spherotech, yellow histogram) microspheres using the digital lifetime cytometry approach. The resulting lifetimes were 6.9 ns (+/− 0.44ns) and 2.5 ns (+/−0.38ns), respectively. The x-axis label is the true fluorescence lifetime in units of 0.1 nanoseconds.
