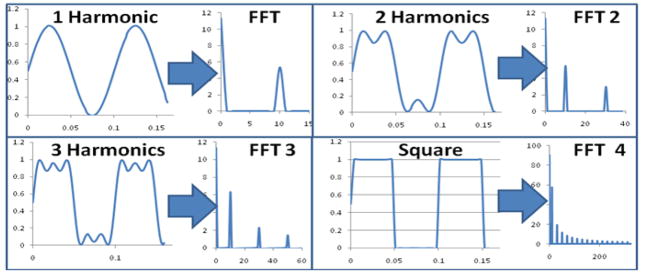
Figure 7.

Graphical representation of square wave modulation coupled with Fourier Transform analysis to extract multi-frequency information for heterogeneous fluorescence lifetime measurements. In the four quadrants of the figure, the harmonics (data simulated in MathCAD) are increased steadily to show that multiple frequencies can be extracted for multiple fluorescence decays.
