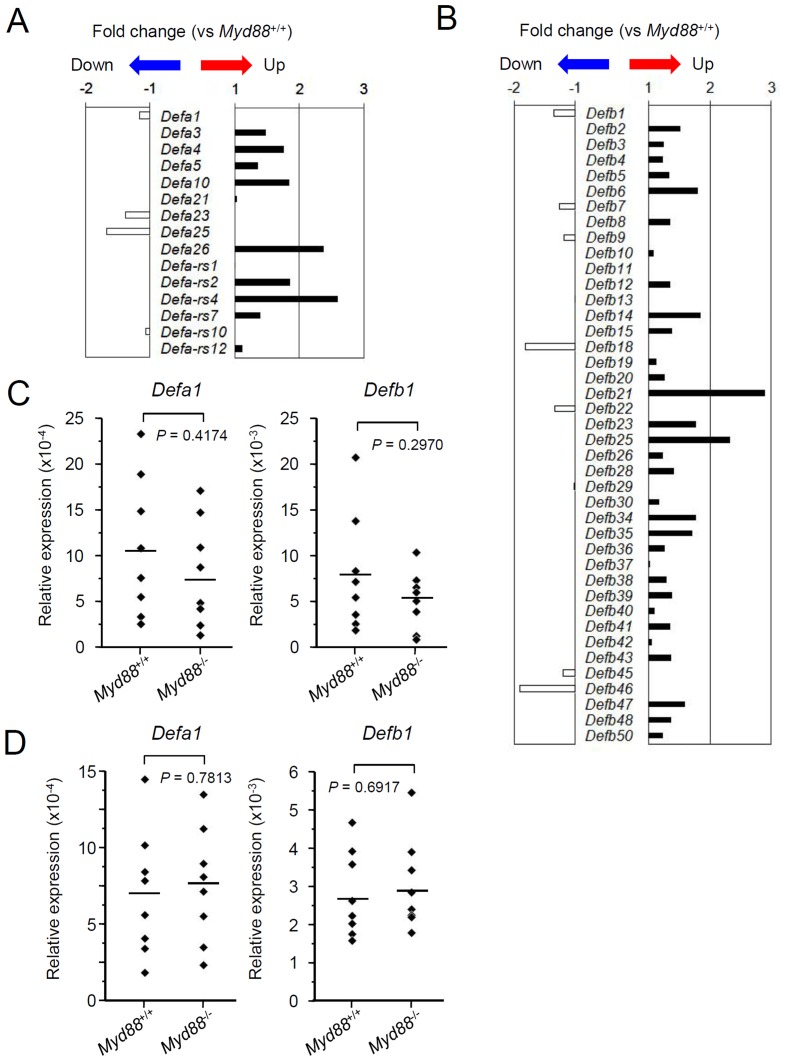
Figure 3. Analysis of expression of the genes encoding defensins in SGs.
A and B: Microarray analysis of the genes encoding α-defensins (A) and β-defensins (B). Total RNA was prepared from SMGs from Myd88 +/+ mice and Myd88 -/- mice at 10 weeks old (n = 3 each). The mean value of fold-change for each gene in SMGs from Myd88 -/- mice shown here was calculated relative to the mean value of expression of that gene in SMGs from Myd88 +/+ mice. Statistical analysis was performed by unpaired Student's t-test. C and D: qRT-PCR analysis for expression of Defa1 (left) and Defb1 (right) in SMGs (C) and SLGs (D). Total RNA was prepared separately from SMGs and SLGs collected from Myd88 +/+ mice and Myd88 -/- mice at 10 weeks old (n = 8 each). Expression levels of Defa1 and Defb1 in SMGs and SLGs were calculated relative to expression of the Hprt1 housekeeping gene. Means of each group were shown and P values were calculated by unpaired Student's t-test.

