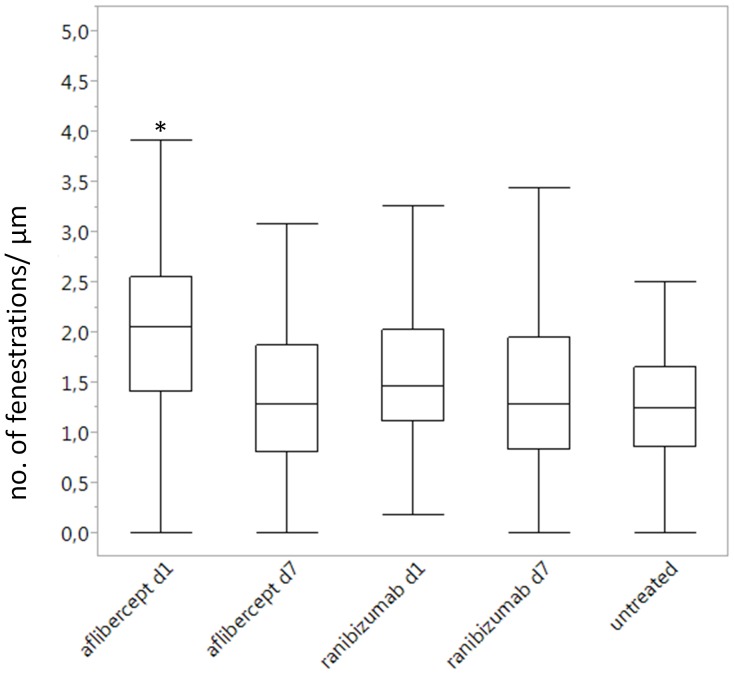
Figure 8. Box plot representation of the quantification of the fenestrations per µm depending on the treatment and its duration.
Application of the Student's test showed no significant differences in the number of fenestrations per µm except one day after aflibercept's injection where the number was increased compared to all other groups (*, p<0.05).

