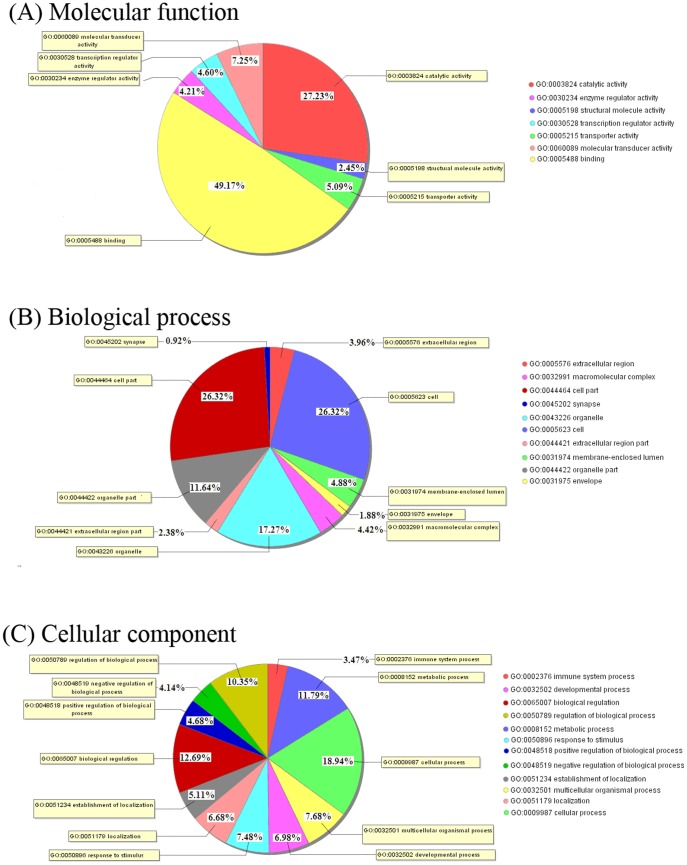
Figure 5. Gene ontology (GO) analysis of the Bama minipig transcriptome data (GO level 2).
GO analysis of 822 genes differentially expressed between the HFHSD group and the control group, which was used to predict the genes' involvement in biological processes (A), molecular functions (B) and cellular components (C). The GO Id and name are shown with different colors.

