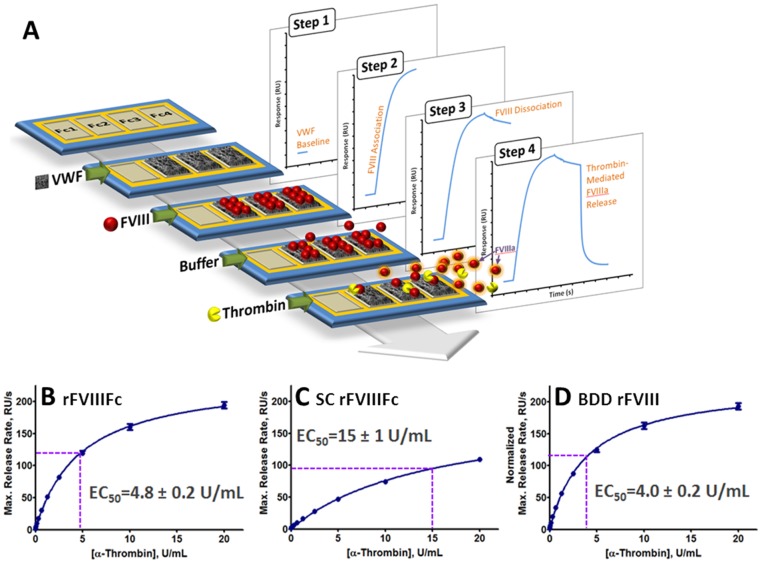
Figure 4. Thrombin-mediated release of activated FVIII variants from VWF.
(A) Schematic of the optical biosensor method developed to evaluate the dependence of VWF release rates on thrombin concentration. A detailed description is provided in Materials and Methods. (B–D) Determination of thrombin concentrations corresponding to half-maximal release rates (EC50) for (B) rFVIIIFc, (C) SC rFVIIIFc, and (D) BDD rFVIII. For BDD rFVIII, ordinate values were normalized on a molar basis to account for the molecular weight difference between rFVIIIFc and SC rFVIIIFc (220 kDa), and BDD rFVIII (170 kDa).

