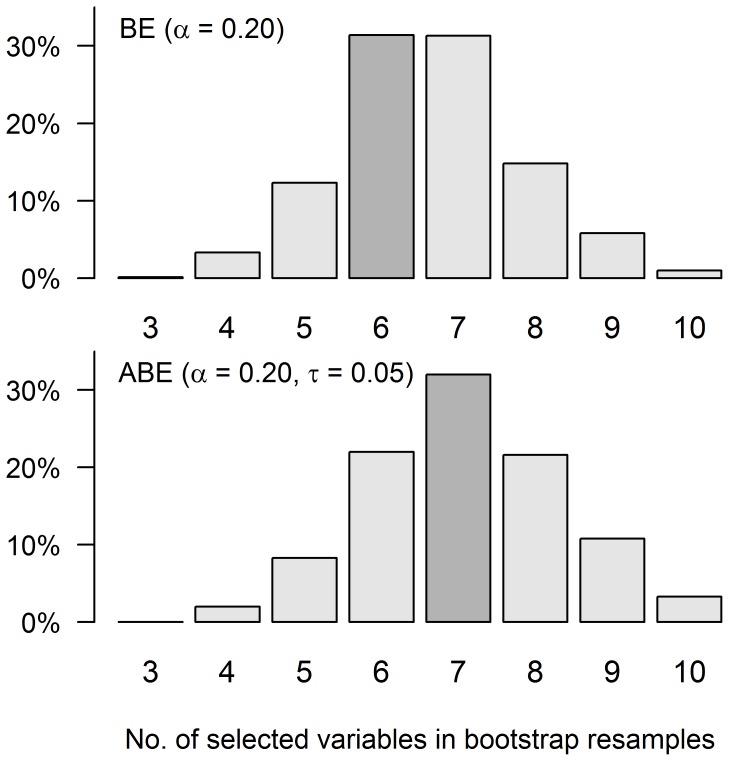
Figure 3. Urine osmolarity example: number of selected variables in the final models of  bootstrap resamples for backward elimination BE with
  and augmented backward elimination ABE with
  and
and  .
.
The highlighted bars indicate the number of selected variables in the original sample. Abbreviations and symbols:  , significance threshold; ABE, augmented backward elimination; BE, backward elimination;
  , change-in-estimate threshold;.

