
Figure 3.
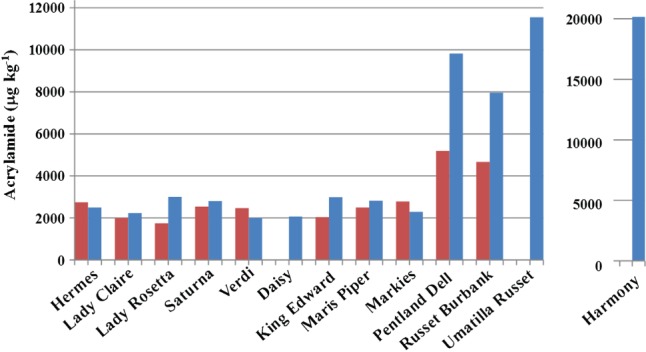
Acrylamide formation (µg kg−1 dry weight) in tuber flour heated to 160°C for 20 minutes for 13 potato varieties before storage (red) and after storage (blue). Harmony is shown separately on a different scale because of the relatively high concentration of acrylamide that formed in flour from that variety. Back-transformed means from analysis of variance (ANOVA) are shown except for Daisy, Umatilla Russet and Harmony, which were not included in the ANOVA because of spoilage of the unstored samples and for which the raw mean for the stored samples is shown for comparison. Statistical analysis of the data is given in Tables 1 and 3.