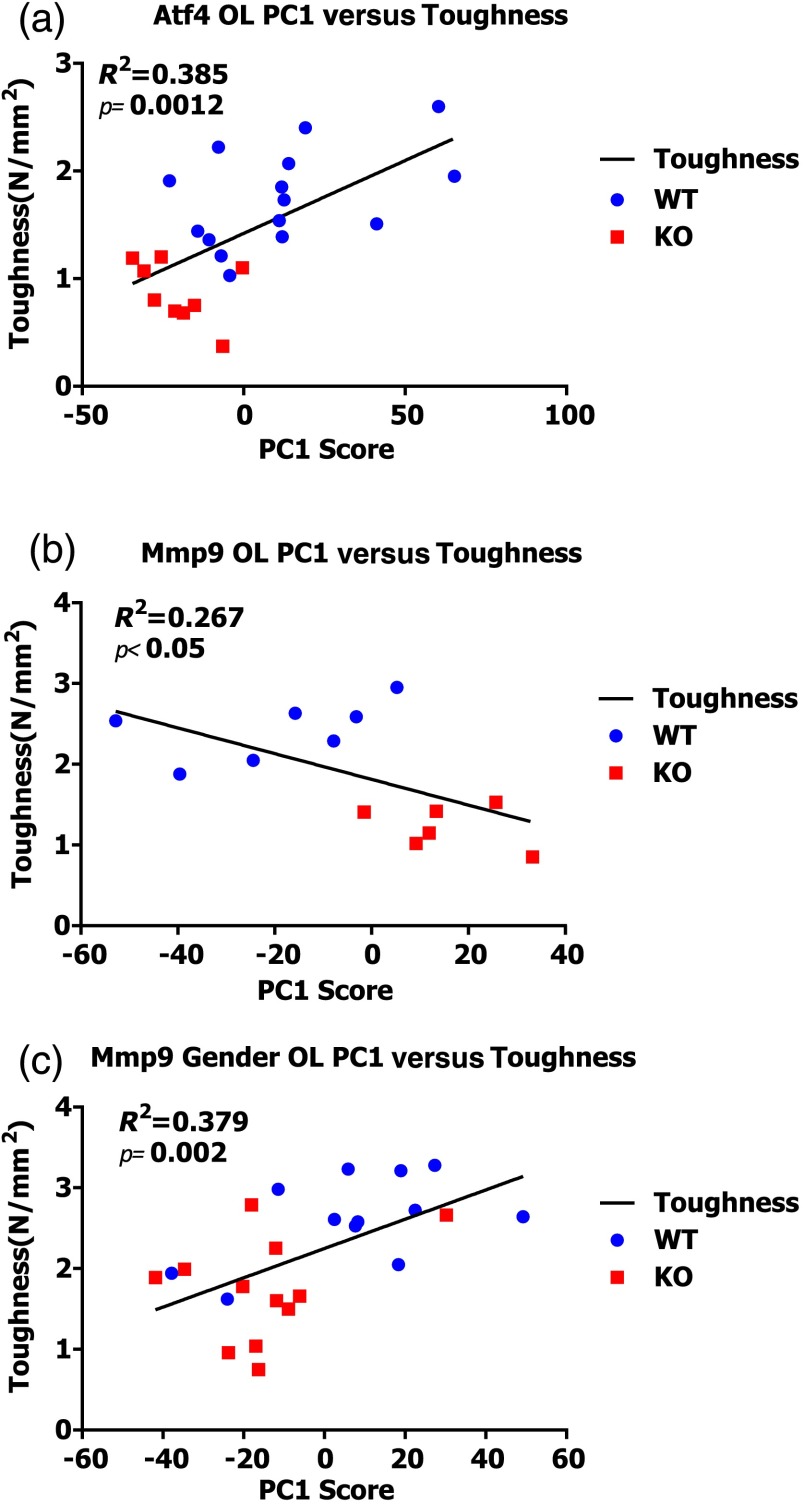
Fig. 6.
Linear regressions of principal component scores significantly explain a portion of bone toughness. (a) PC1 score explains toughness and separates genotype in Atf4. (b) Despite small sample size, PC1 score explains over 20% of variance in toughness of Mmp9 male samples. (c) Despite overlap due to gender, PC1 score significantly explains over 35% of Mmp9 toughness.

