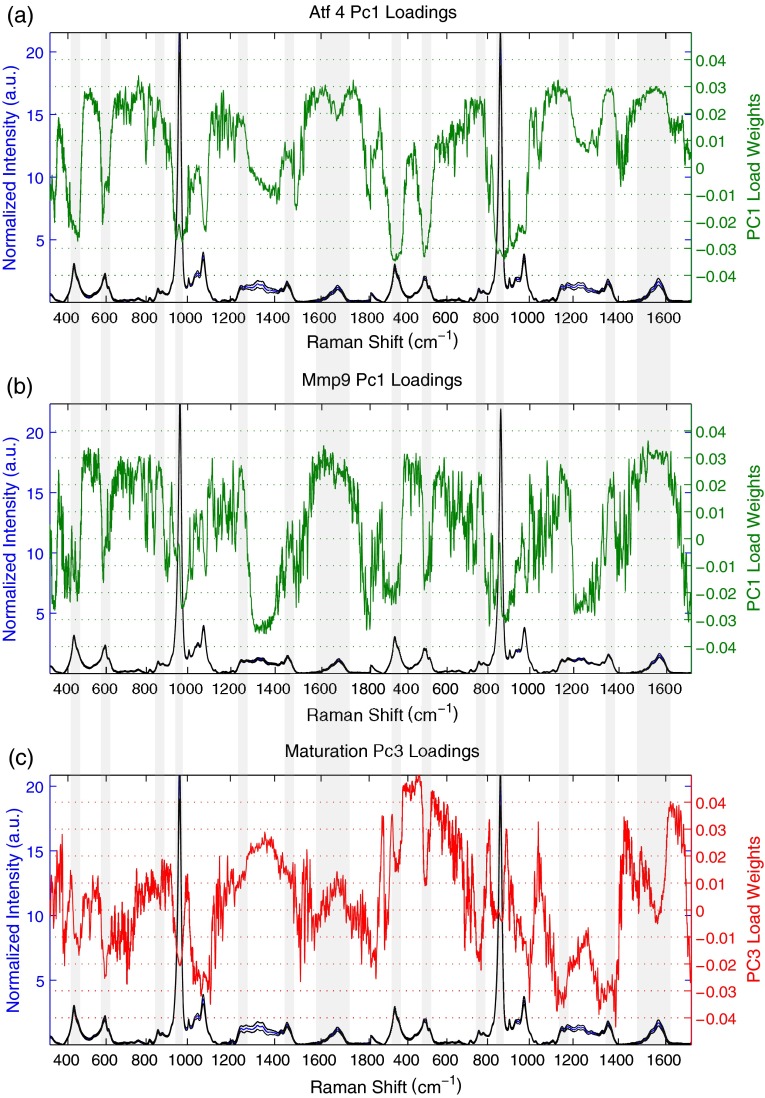
Fig. 7.
Principal components that explain toughness demonstrate consistent loadings among studies. Gray overlay is used to accent regions of greatest similarity between models of brittle bone. (a) PC1 of Atf4 male mice demonstrates strong positive collagen and strong negative mineral loadings. (b) Similar positive collagen weights and negative mineral weights explain toughness in PC1 of Mmp9 male mice. (c) PC3 of maturation provides best separation of class, but demonstrates strong differences in loading when compared to components from brittleness models.

