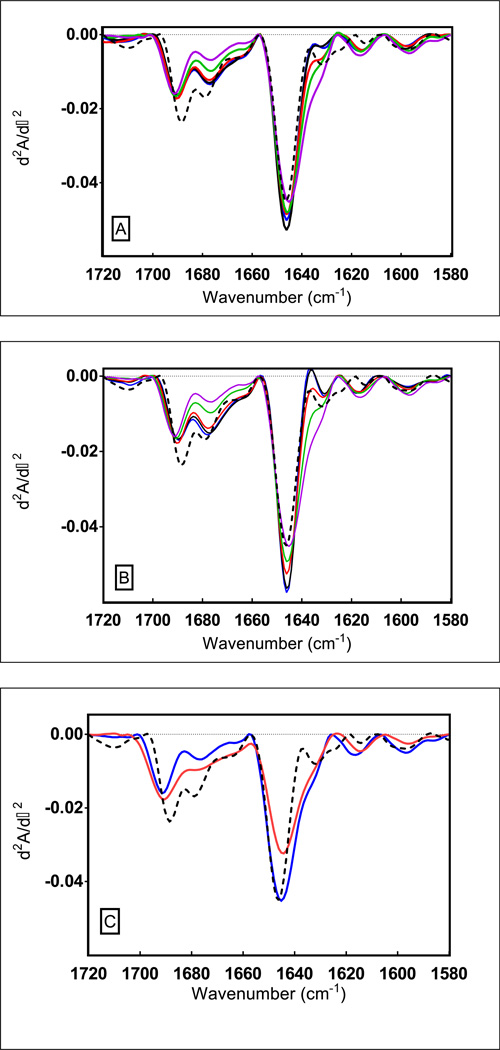
Figure 3. Second derivative FTIR absorbance (d2A/d-2) spectra of KGF-2 in disaccharide-HES freeze-dried formulations determined immediately after lyophilization.
The dashed trace belongs to the KGF-2 liquid control. Panel A (Sucrose-HES series) and B (Trehalose-HES series) shows increase in perturbation of native secondary structure when freeze-dried with increasing concentrations of HES; 0% HES (blue trace), 1% HES (black trace), 2.5% (red trace), 4% HES (green trace) and 5% HES (magenta trace). Panel C) shows comparison between native secondary structural perturbation of KGF-2 when freeze-dried with ‘HES alone’ (blue trace) and when freeze- dried in ‘buffer alone’ (red trace).

