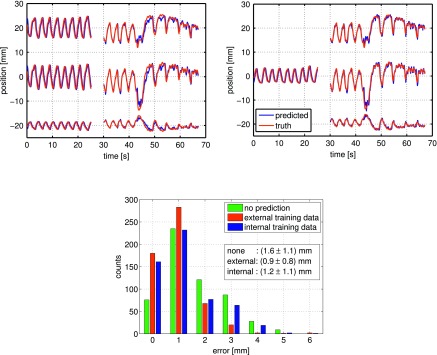
FIG. 3.

(Top) Tumor trajectory example (x, y, z from top to bottom). (Top left) Trained with 3D internal motion data, (top right) trained with 1D external motion data and adaptively retrained with at 1 Hz. (Bottom) Histogram of 3D error for the shown trajectory. In this rather irregular case, the rms error was reduced by 39% for the case of external surrogate training and 18% for tumor motion data training. The used data and prediction model parameters were νs = 15 Hz, Ttrain = 25 s, (for external case only), Ttest = 40 s, Tp = 3 s, λ = 0.025, respectively.
