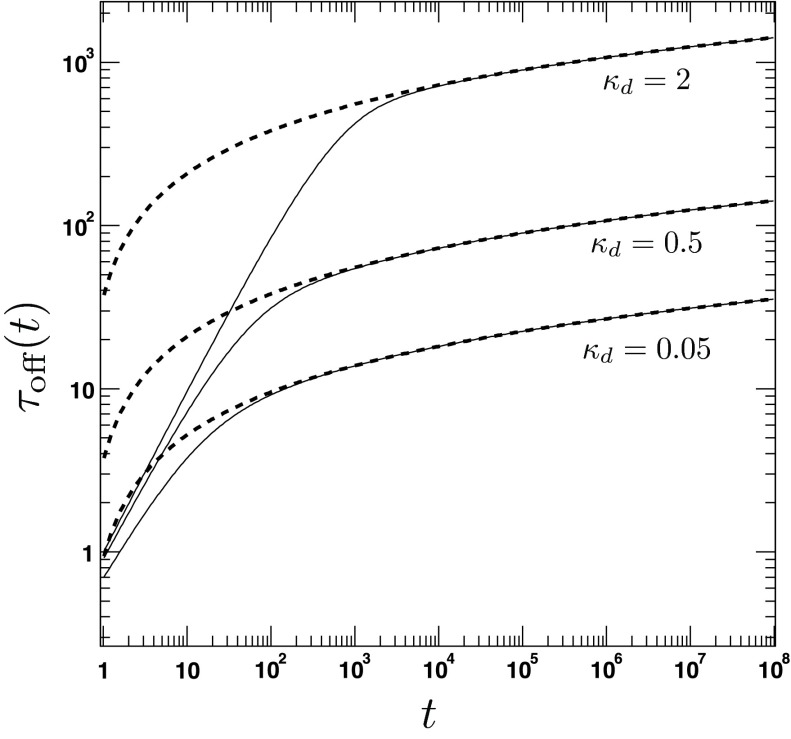
FIG. 8.
The average lifetime τoff(t) of the bound state. The figure shows the time dependence of τoff(t) for different values of the intrinsic dissociation rate κd = 0.05, 0.5, 2. The other parameters are a = 1.5, D = 1, κr = 5. The solid lines are obtained from the exact analytical expression for τoff(t) (Eqs. (117)). The dashed lines refer to the approximate long-time solution (Eq. (124)).

