Figure 2.

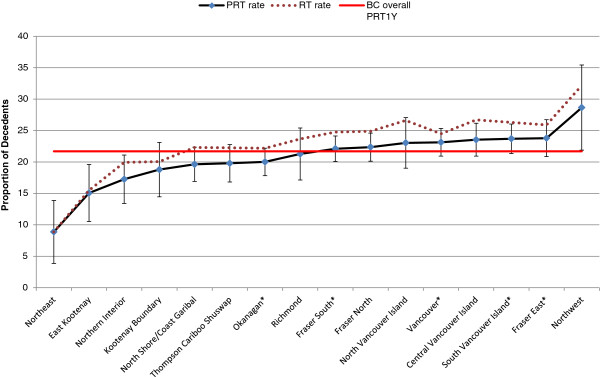
Regional PRT 1Y rates. * indicates the region where a cancer center is located. Note: the horizontal line is the average provincial PRT1Y rate and the bars show the PRT1Y rate with a 95% confidence interval for the HSDA.

Regional PRT 1Y rates. * indicates the region where a cancer center is located. Note: the horizontal line is the average provincial PRT1Y rate and the bars show the PRT1Y rate with a 95% confidence interval for the HSDA.