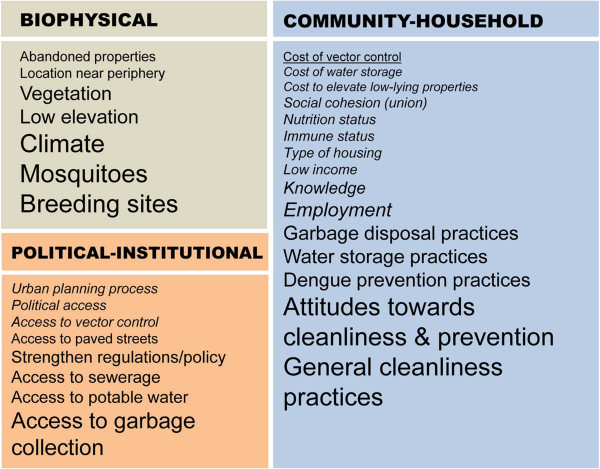
Figure 3.

Risk factors associated with dengue identified through a thematic analysis of causal diagrams. Font size indicates the number of focus groups in which the theme emerged (range 1 to 6). Themes that emerged only from the peripheral area (PA) are in italics; themes only from the central area (CA) are underlined.
