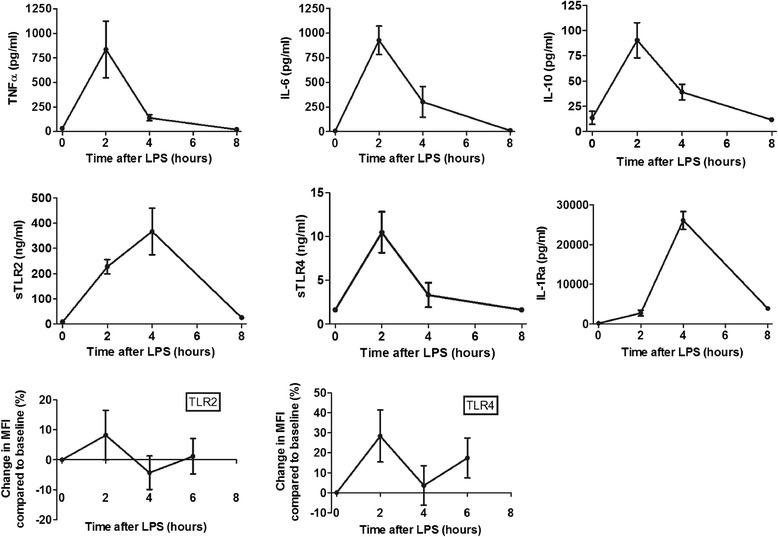
Figure 2.

Mean (± SEM) plasma concentrations of TNFα, IL-6, IL-10, sTLR2, sTLR4 and IL-1Ra after administration of LPS intravenously in 11 healthy volunteers (upper 6 panels). Lower panels show mean change (± SEM) in expression of TLR2 and TLR4 on CD14+ monocytes (mean fluorescence intensity (MFI)) compared to baseline after injection of LPS.
