Figure 4.

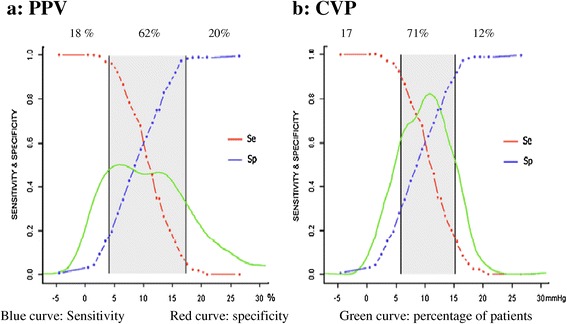
Grey zones of pulse pressure variation (PPV) (a) and central venous pressure (CVP) (b). Blue curve: sensitivity; red curve: specificity; green curve: percentage of patients.

Grey zones of pulse pressure variation (PPV) (a) and central venous pressure (CVP) (b). Blue curve: sensitivity; red curve: specificity; green curve: percentage of patients.