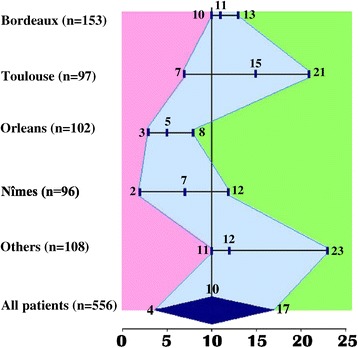
Figure 5.

Grey zone according to the centre (centres in which the number of inclusion was under 70 were pooled together) and factors influencing on the ability of PPV to predict fluid responsiveness. Each bar represents the grey zone of the corresponding centre with its lowest limit (specificity ≥90%), its best threshold and its highest limit (sensitivity ≥90%).
