
Figure 3.
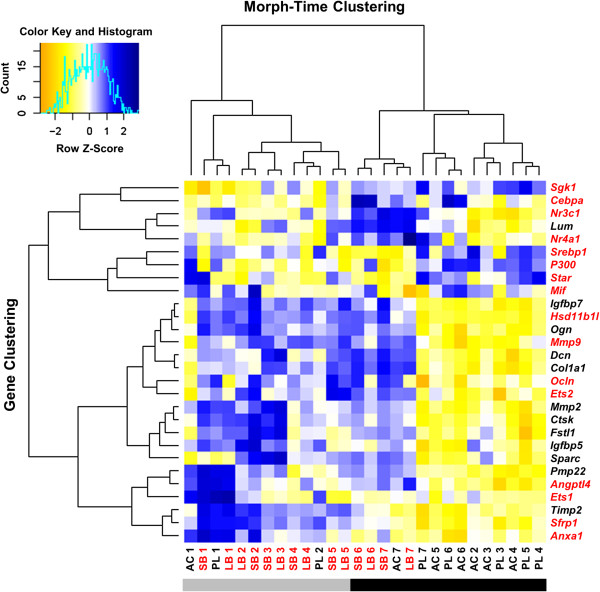
Distinct morph- and time-dependent gene expression in the developing head of Arctic charr. Heat map showing the relative expression of candidate network genes (black) and 16 genes associated with glucocorticoid (GC) signalling (red) in two limnetic morphs (black) and two benthic morphs (red) at seven developmental stages. Hierarchical clustering was performed on genes (vertical axis) and on samples (morph and timepoint, horizontal axis). Blue represents higher expression and yellow lower expression relative to the average levels across all samples. The bar below the figure underlines the two major branches of sample clustering.