
Figure 4.
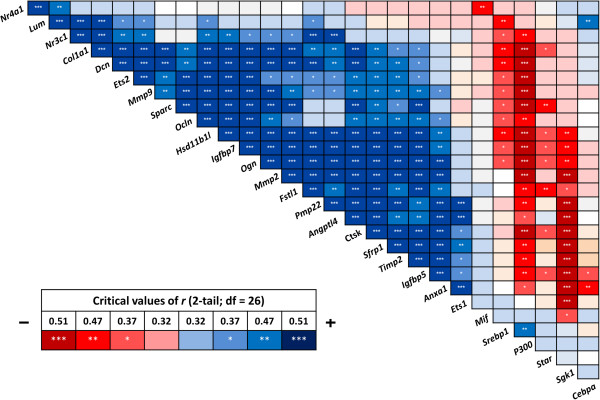
Correlation analysis reveals significant positive or negative coexpression of the candidate genes. Pearson correlation coefficient (r) was used to assess the pairwise expression similarity between the candidate genes during craniofacial development. Blue represents positive and red represents negative expression correlation. A scale showing critical values of r is depicted with corresponding colours. *P <0.05; **P <0.01; ***P <0.001.