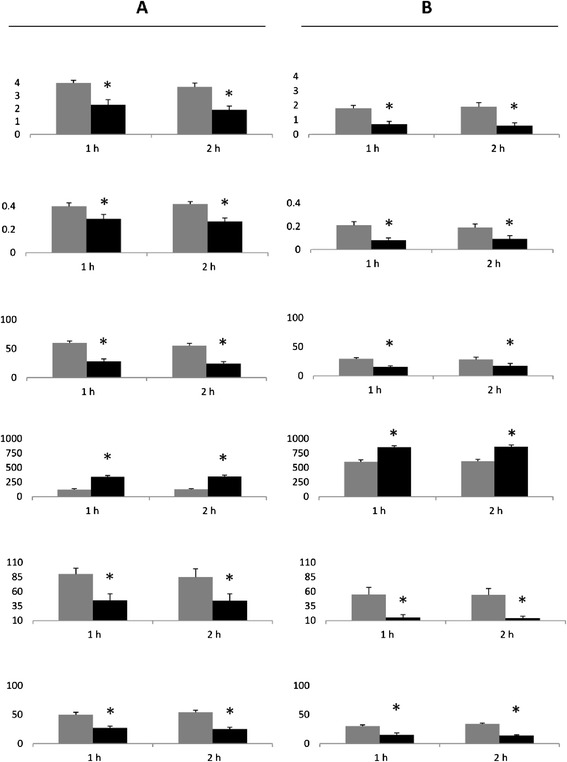
Figure 3.

Δ changes between baseline and after diet intervention. A: Comparison between the Δ of the changes in FMD, nitrotyrosine, 8-iso-PGF2a, insulin, IL-6 and ICAM- during baseline hyperglycemic clamp (grey column) and hyperglycemic clamp after MedDiet intervention (black column). B: Comparison between the Δ of the changes in FMD, nitrotyrosine, 8-iso-PGF2a, insulin, IL-6 and ICAM- during baseline hyperglycemic clamp + GLP-1 (grey column) and hyperglycemic clamp + GLP-1 after MedDiet intervention (black column). *p < 0.01.
