
Figure 2.
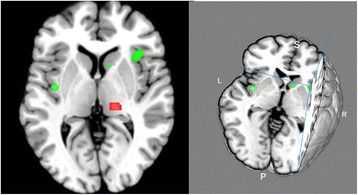
3D (right) and 2D (left) ALE map representing the decreased metabolism (color in green) of insula, limbic system and basal ganglia, and the increased metabolism of thalamus, and cerebellum (color in red) in MDD patients compared to normal controls (P<0.05, FDR-corrected) (produced by Mango Image Viewer, http://www.brainmap.org/tools.html ).