
Figure 4.
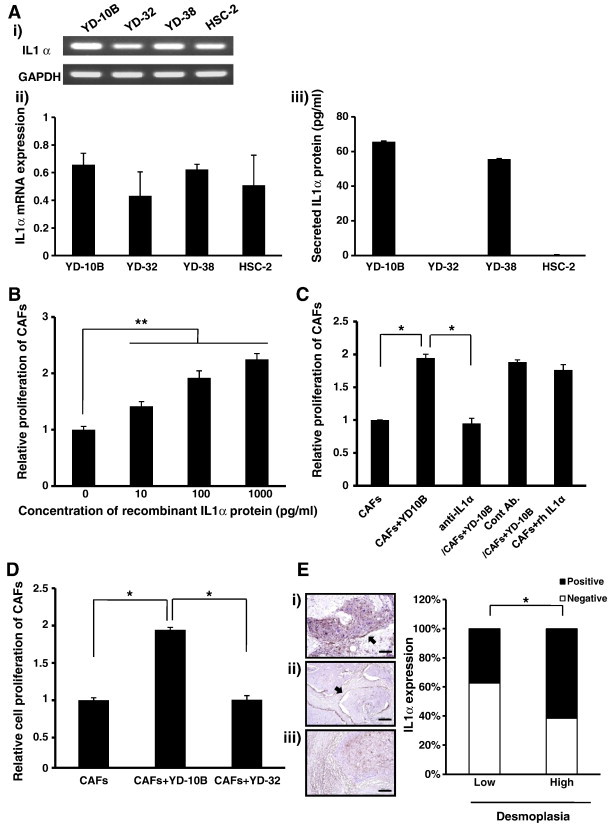
Proliferation of CAFs under various IL-1α-expressing conditions. (A) (i, ii) Expression levels of IL-1α mRNAs in OSCC cells were determined by RT-PCR. (i) Micrographs shown in this figure are representative of three independent experiments that showed similar results. (ii) Results were quantitatively analyzed and normalized to GAPDH expression. (iii) Secretion levels of IL-1α proteins were determined by ELISA. (B) Proliferation of CAFs was measured after treatment with or without IL-1α human recombinant protein at different doses (0, 10, 100, and 1000 pg/ml). (C) Cell proliferation of CAFs treated with or without 1 μg/ml neutralizing antibody against IL-1α. Mouse IgG2A and human recombinant IL-1α protein were used as controls. Treatment concentration of human recombinant IL-1α protein was 50 pg/ml. (D) Proliferation of CAFs co-cultured with YD-10B or YD-32. Proliferation of CAFs was measured by the MTT assay after 1-week incubation for all experiments. Quantitative results indicate average values of three independent experiments, each of which was conducted in triplicate (n = 9). The results are shown as mean values ± SD (n = 9) and were analyzed by the Mann-Whitney U test (⁎P < .05 and ⁎⁎P < .01). (E) Histomorphometry of IL-1α expression was performed in 100 human OSCC surgical specimen slides. (i) IL-1α expression in tumoral portion of OSCC. (ii, iii) IL-1α expression in stromal portions of OSCC. The micrographs shown in this figure are representative of 100 different tissues that showed similar results. All sections were viewed at × 100 magnification (scale bar, 200 μm). Relationship between IL-1α expression and the level of desmoplasia. IL-1α expression in each group was compared by the χ2 test (*P < .05).