
Figure 2.
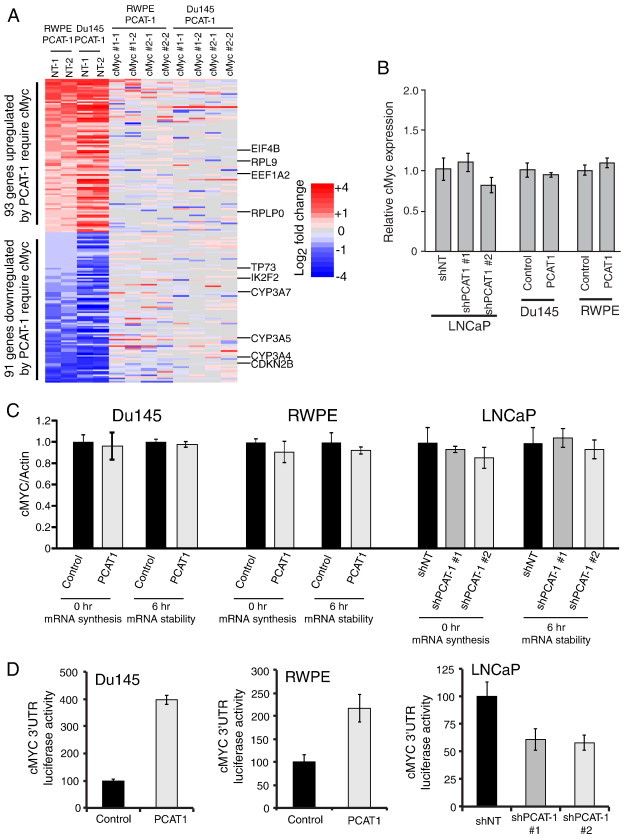
PCAT-1 regulates cMyc in a post-transcriptional manner by 3′UTR activation. (A) Gene expression analysis of Du145–PCAT-1 and RWPE–PCAT-1 cells treated with non-targeting or cMyc siRNAs reveals a gene signature of genes co-regulated by PCAT-1 and cMyc. In this figure, the columns on the far left show gene expression changes in RWPE–PCAT-1 and Du145–PCAT-1 cells treated with non-targeting siRNA compared to RWPE and Du145 control cells treated with non-targeting siRNA, respectively. On the right, RWPE–PCAT-1 and Du145–PCAT-1 cells were treated with two independent siRNAs for cMyc, and the indicated gene expression values of these cells were calculated relative to the RWPE and Du145 control cells treated with non-targeting siRNA. All experiments were analyzed with duplicate microarrays, as indicated at the top of the heat map. (B) MYC mRNA expression levels are unchanged in three in vitro model systems of PCAT-1. (C) MYC mRNA stability is unchanged in Du145–PCAT-1, RWPE–PCAT-1, or LNCaP sh–PCAT-1 cells. (D) Luciferase signal for the MYC 3′UTR activity is increased in Du145–PCAT-1 and RWPE–PCAT-1 cells but decreased in LNCaP sh–PCAT-1 cells. In this figure, NT stands for non-targeting control.