
Figure 3.
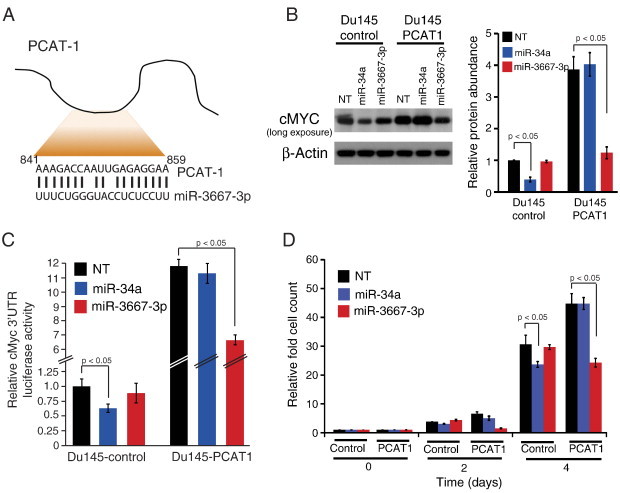
PCAT-1 interferes with microRNA networks regulating cMyc. (A) A schematic demonstrating base-pair complementation between PCAT-1 and miR-3667-3p. (B) Left: cMyc protein abundance in Du145 control and Du145–PCAT-1 cells following overexpression of miR-34a or miR-3667p. Note that a long exposure of the immunoblot is shown to illustrate relative protein abundance. Right: Quantification of cMyc protein abundance. Significance is determined by three independent experiments. (C) MYC 3′UTR luciferase signal following overexpression of miR-34a or miR-3667-3p in cells with and without PCAT-1 overexpression. (D) Cell proliferation of Du145 control or Du145–PCAT-1 cells following overexpression of miR-34a or miR-3667-3p. A non-targeting NT scrambled RNA serves as a control. Error bars represent mean ± SEM. Statistical significance is determined by Student's t test. In this figure, NT stands for non-targeting control.